Eleven pages covering a customer’s whole journey
From the first call to closing, payment and revisits, through lost-deal review and recovery. Each page does one job, and does it properly.
Dashboard
Seven key figures plus today’s and overdue lists, so you know where to start.
Customers
Filter by stage, owner or overdue, search by keyword; phone numbers are partly masked.
Reminders
Overdue, today, next three days. Overdue stays until it is truly handled.
Deal stats
Monthly revenue, count and average deal, by owner and source, with a six-month trend.
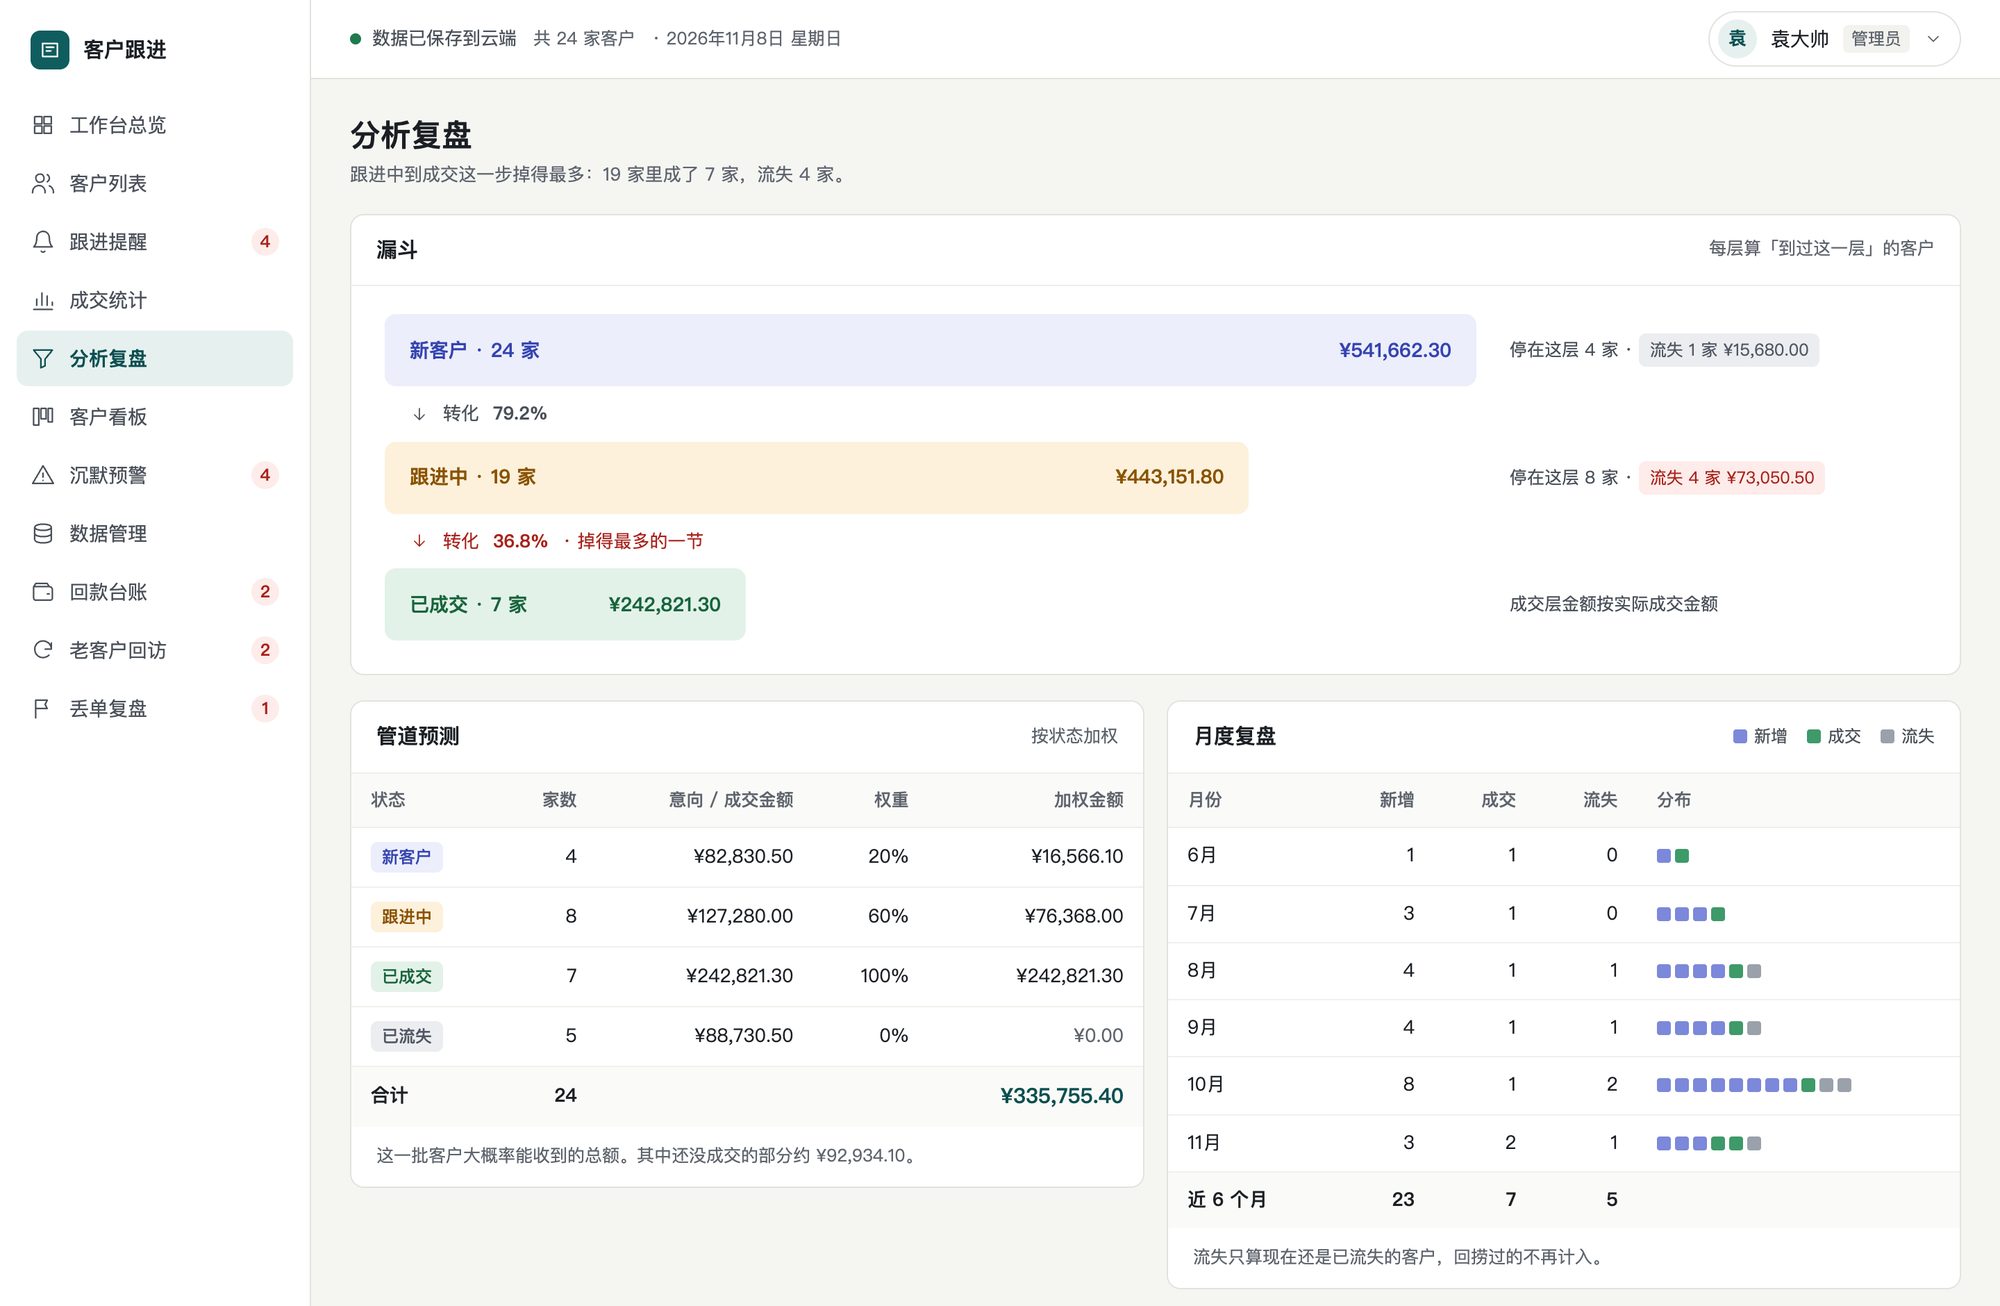
Analysis
Funnel, weighted pipeline forecast, and month-by-month new, won and lost.
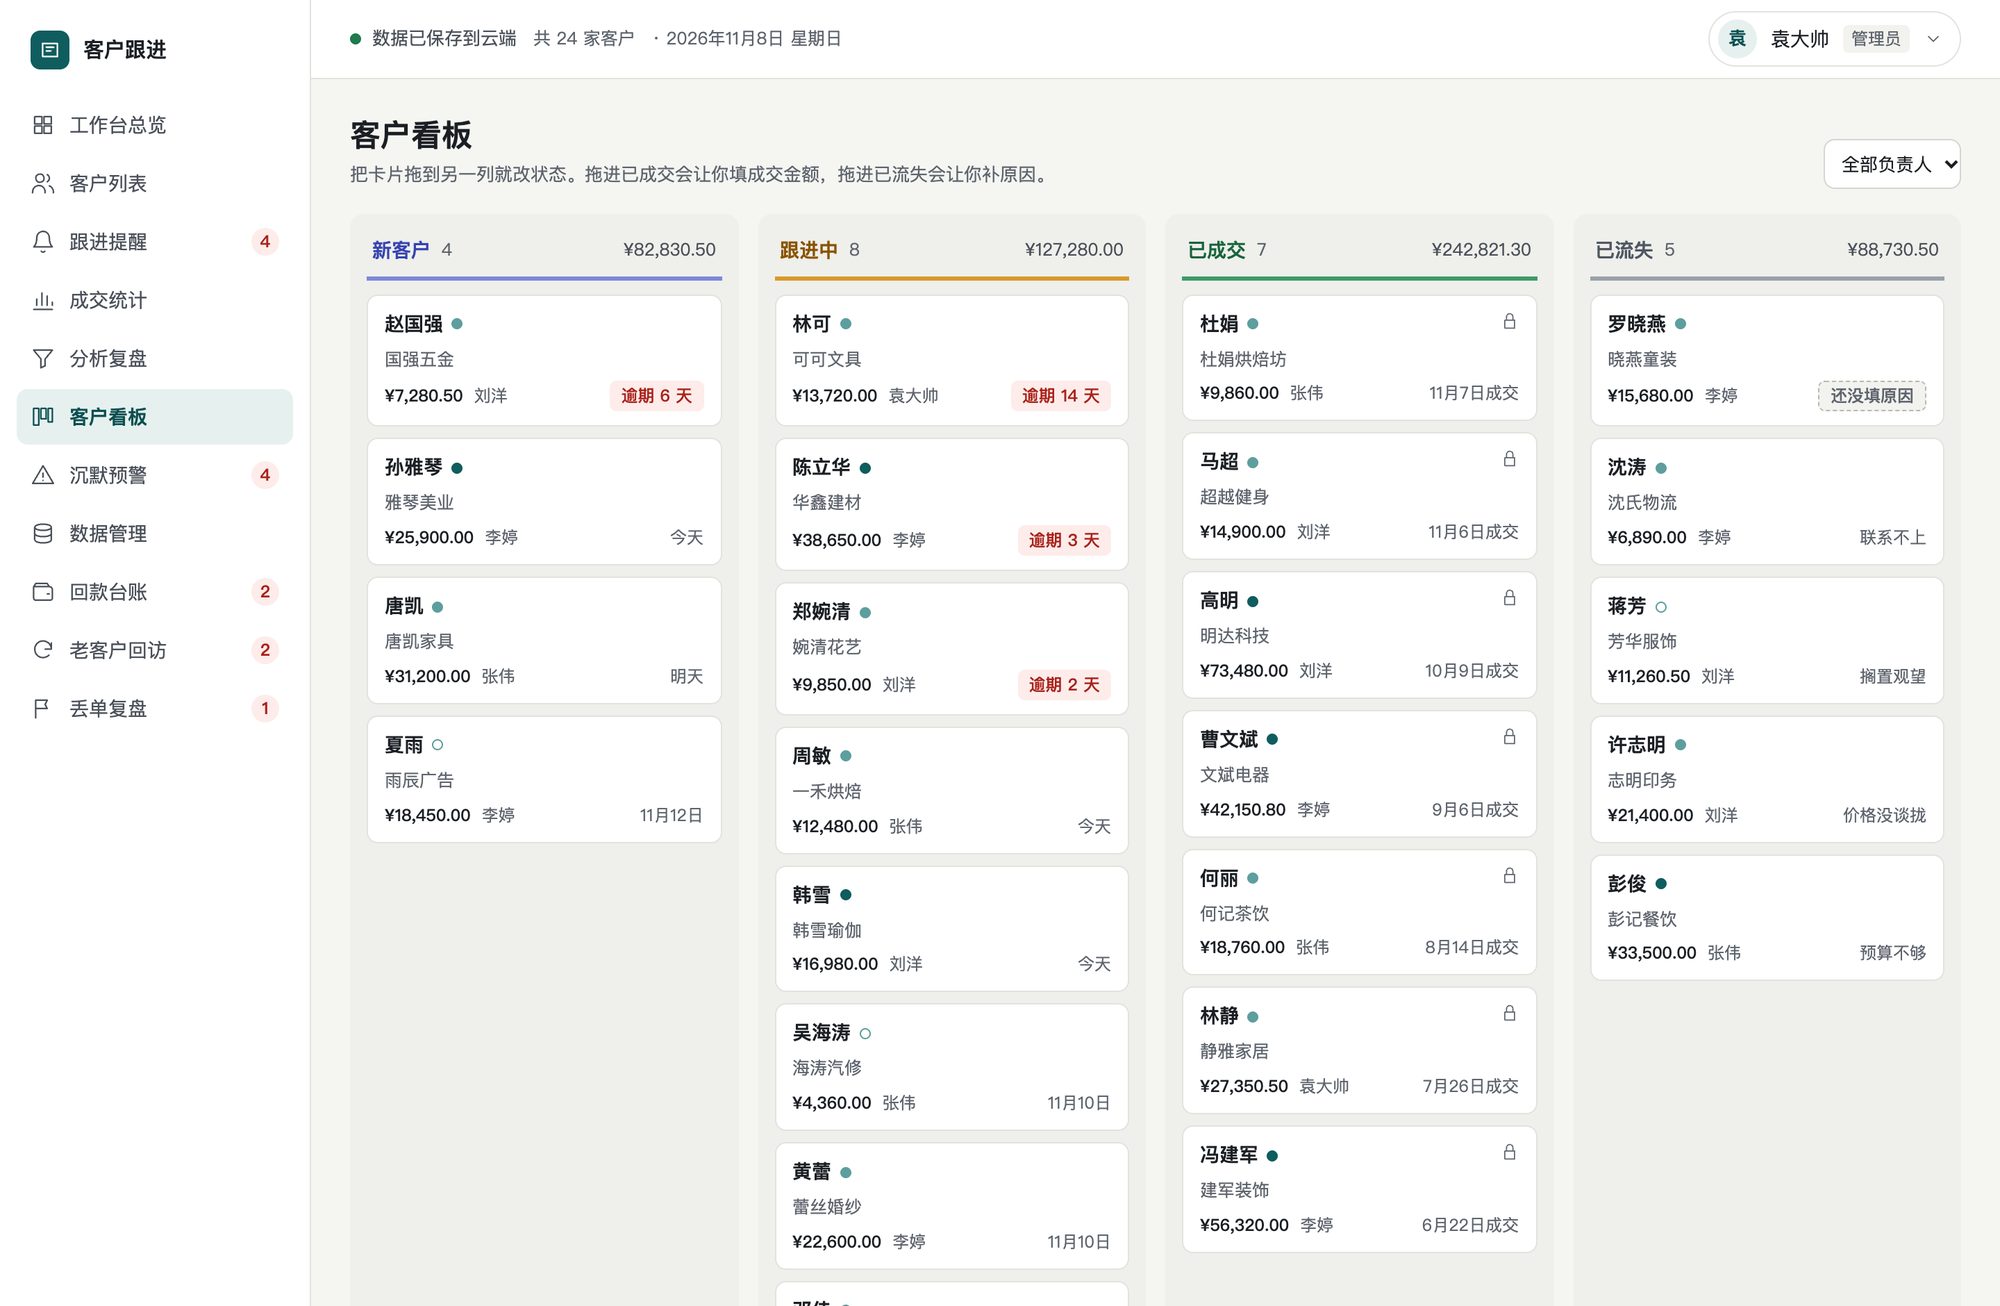
Board
Four columns of cards; drag to change stage, with prompts when won or lost.
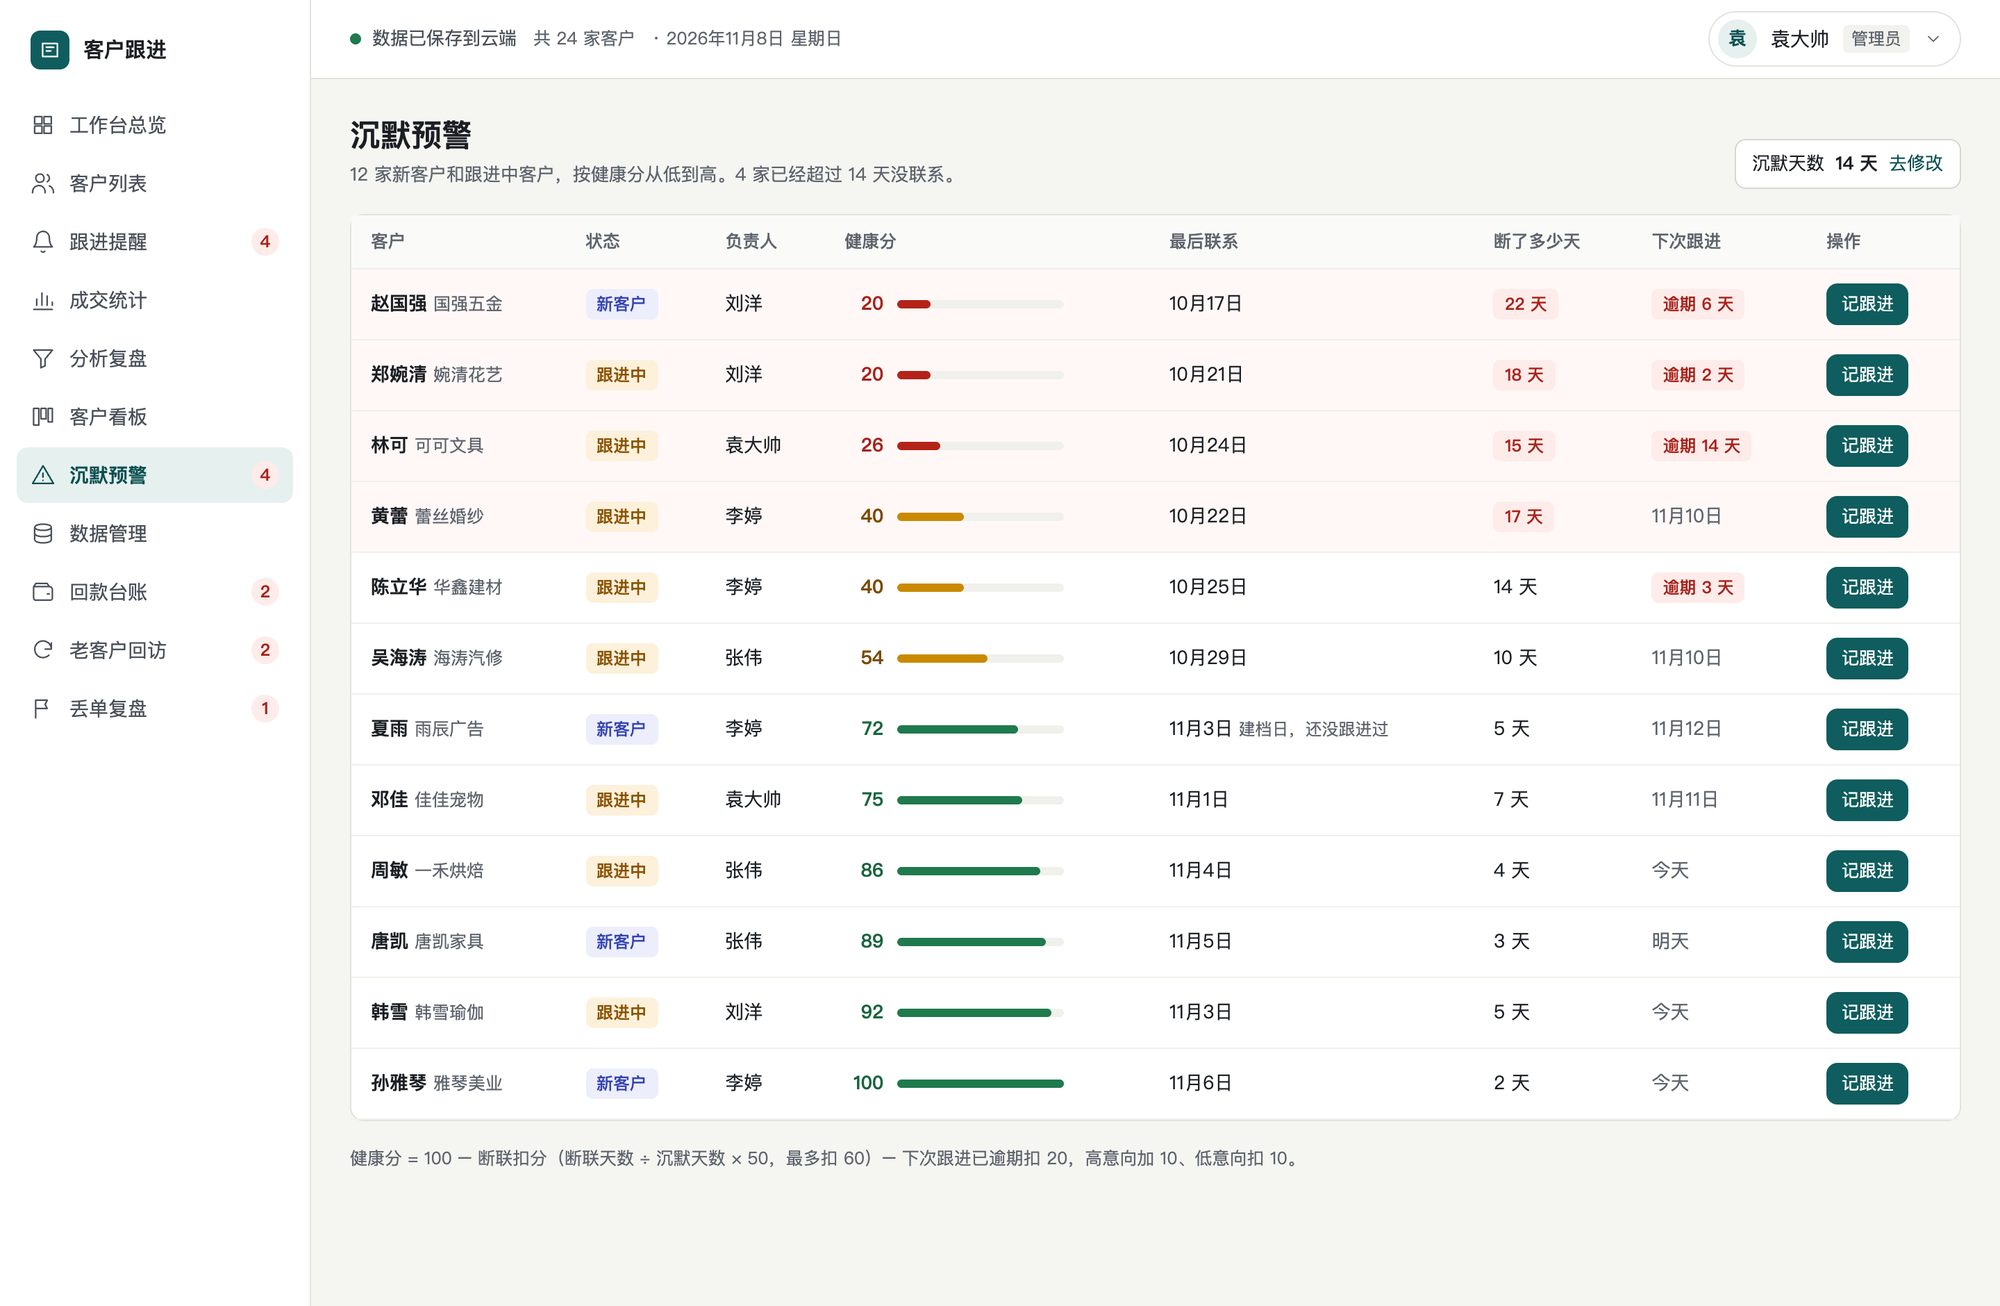
Silence alerts
Ranked by health score; anyone quiet past your threshold turns red.
Data
Reminder settings, team and sources, backup export and bulk import from Excel.
Payments
Contract, received, outstanding and due date; overdue in red, debtors first.
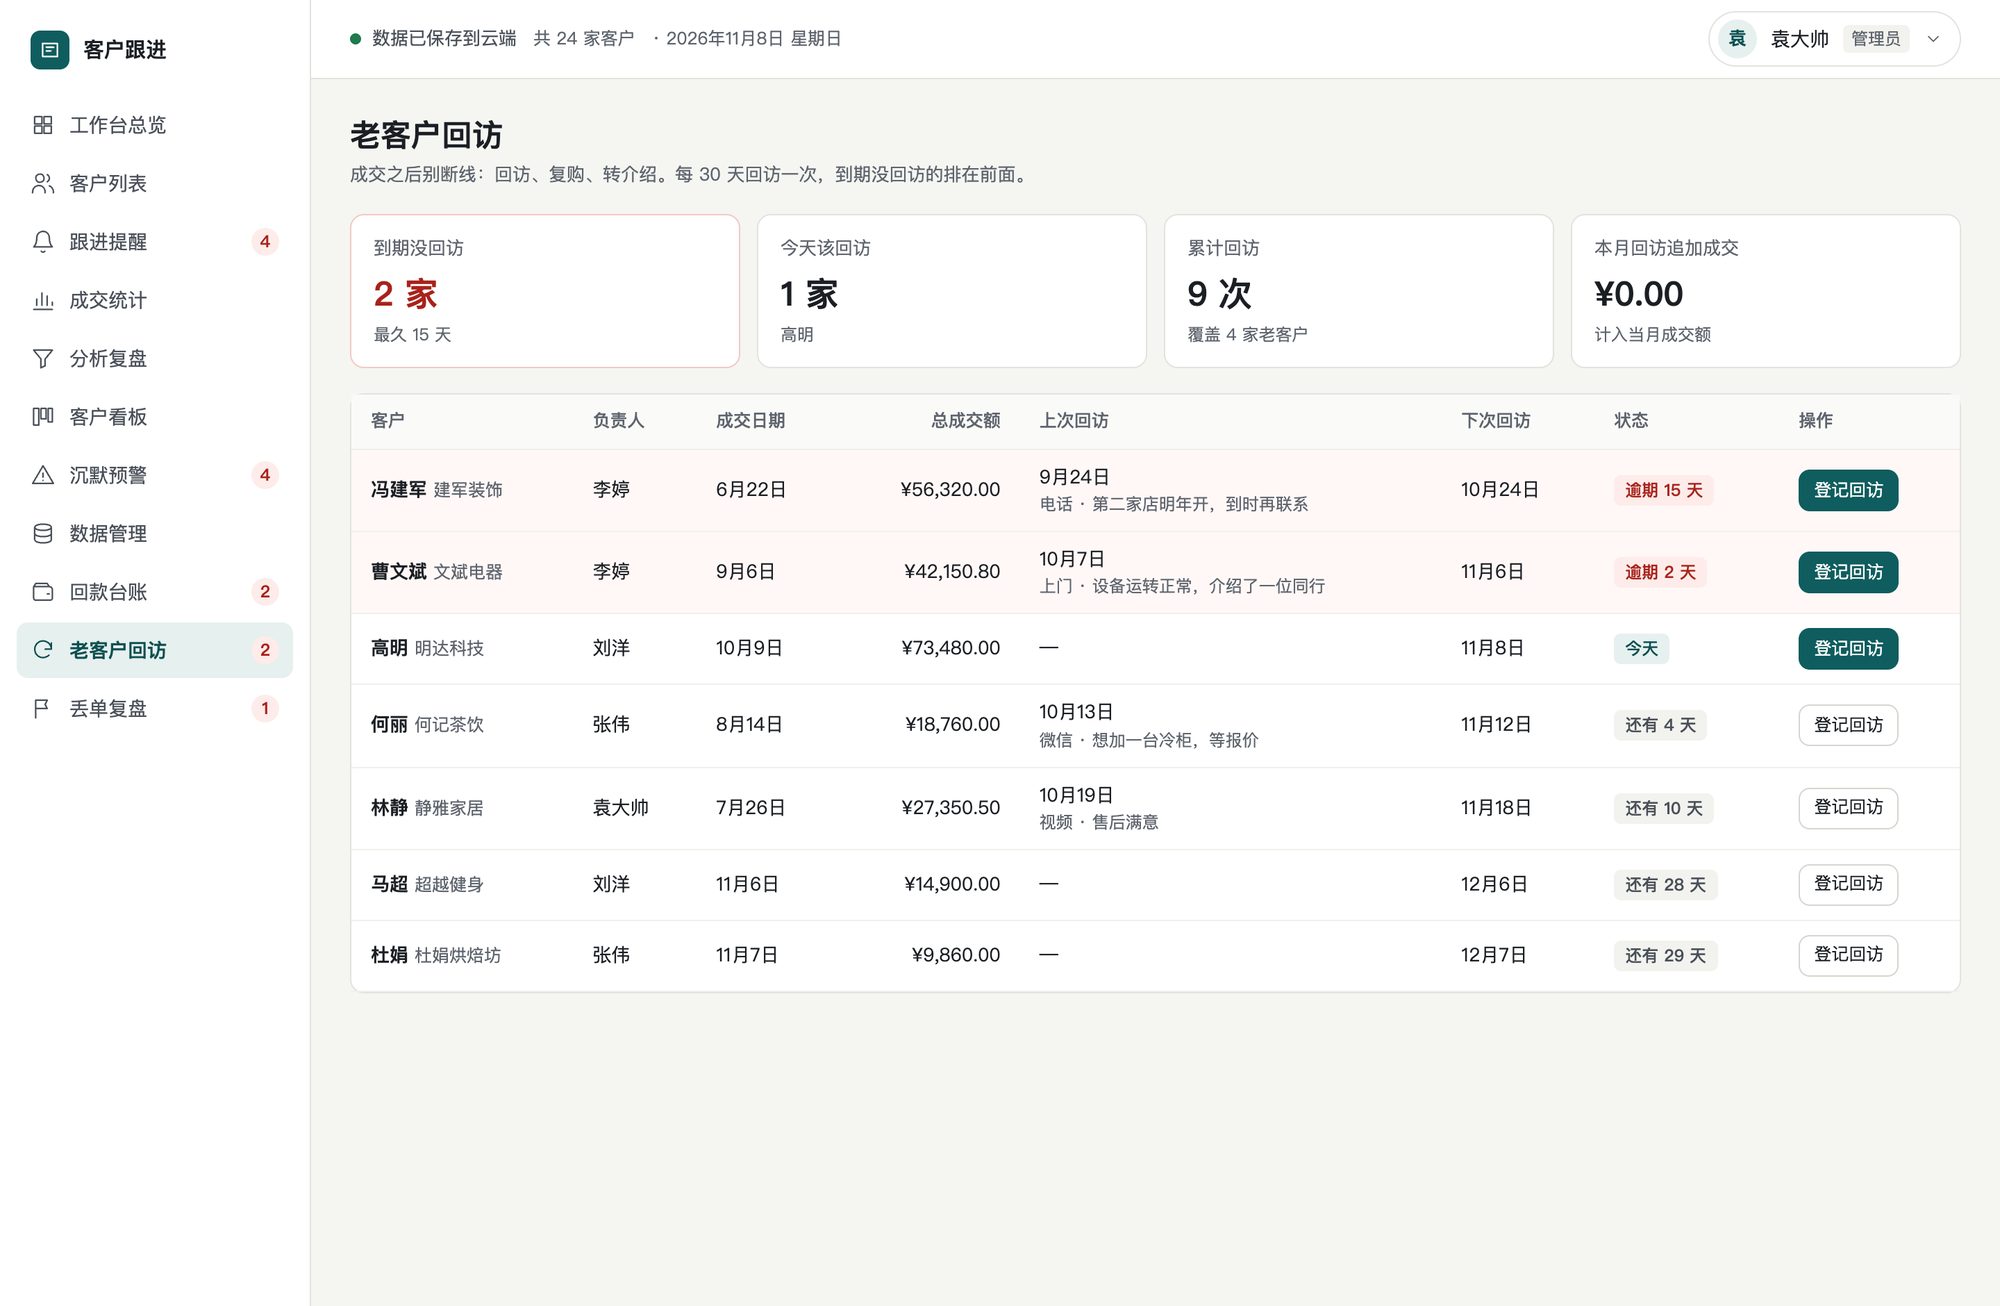
Revisits
Periodic check-ins with past customers; upsells add to the deal total.
Lost deals
Seven fixed reasons ranked by amount, with reminders to try again.
See it in action
Screenshots below use the system’s demo data.
Every number explains itself
Fixed, published definitions, and totals that always reconcile: lost-deal rows add up to the headline figure.
| Metric | How it is calculated |
|---|---|
| Win rate | Won ÷ (won + lost). Deals still in progress are left out. |
| Loss rate | Lost ÷ (won + lost); together with win rate it makes 100%. |
| Expected revenue | 20% of new-lead value plus 60% of in-progress value. |
| Pipeline forecast | New 20%, in progress 60%, won 100%, lost 0%, summed. |
| Health score | 0–100. Longer silence costs more points, overdue costs more; intent level adjusts it. |
| Lost amount | Only customers currently lost; revived ones are excluded. |